ESRC New Investigators Grant (Part 2)
Introduction
In the first part of the post, I wanted to find out what are my chances of securing an ESRC New Investigators grant. Now, using open data from the UK Research and Innovation website, I wanted to have a further breakdown of the types of applications that were successful and how similar or dissimilar they are from each other. The ESRC grant reference numbers are found in the historical data from the ESRC website. That allowed me to search the RCUK website and retrieve information on successful applications. Unfortunately, I couldn’t get the data for those grants that were unsuccessful. Anyhow, I did some data mining to extract the data from the RCUK website and managed to obtain additional information on the successful applications, except for 2 that were not found on the website.
A little bit about the data
The list below shows the type of information that I have extracted and consolidated into a simple data table. I guess the column headings are rather self-explanatory. Perhaps only for the url, which is the web link to the project. The abstract is the abstract of the project and the planned impact is the description of the potential impact this project will have on society. The table below shows 3 web links to 3 different project if you are interested in seeing how it looks on the RCUK web page. Research areas are a combination of both research subjects and research topics. One project may have multiple research subjects and/or research topics. I don’t think it is particularly interesting to look at either the research subjects or research topics individually at this stage. Hence, to avoid confusion, I decided to put them all together and rename as research areas.
| Grant_Reference | country | startDate | PI | Research.Area_5 |
| Funding | University | endDate | Research.Area_1 | Research.Area_6 |
| Score_Category | department | title | Research.Area_2 | Research.Area_7 |
| round | city | abstract | Research.Area_3 | Research.Area_8 |
| url | value | impact | Research.Area_4 | Research.Area_9 |
| Project_URL |
|---|
| https://gtr.ukri.org/projects?ref=ES%2FP010148%2F1 |
| https://gtr.ukri.org/projects?ref=ES%2FP011705%2F1 |
| https://gtr.ukri.org/projects?ref=ES%2FR003254%2F1 |
Quick overview
Okay, given this information let’s do some simple analyses and understand how grants are awarded. Firstly, let’s find out how many Universities were awarded in the past round. In total, 30 universities were awarded the grant for the last 5 months, with a total of 49 grants. Unfortunately, I was not able to extract information for two grants (n = 47). For whatever reason, they were not on the website. Perhaps the ESRC reference number did not match the website parameters. So all analyses are conducted on only 47 grants. If you want to know more about the success rate, please refer to my other blog post. In general, the table below shows the number of successful applicants per round (Please note that the two grants that were excluded from these analyses are from the March 2018 and July 2018 rounds).
| March2017 | July2017 | Nov2017 | March2018 | July2018 |
|---|---|---|---|---|
| 1 | 10 | 16 | 10 | 10 |
Awards
Frequency of awards
Which Universities are doing quite well in the grant?
The Universities are shown in the table below and listed in alphabetical order. It would appear that the University College London, University of Exeter, and the University of Cambridge are doing pretty well. Note: We don’t know how many applicants applied from each university. It might be the case that these 3 universities had a lot more applicants than the rest. Hence, they tend to do better than others. To reorder the ranking in the table below you can click on the downward arrow located beside the column headings.
Frequency of awards in different rounds
What are the chances of a University being awarded twice in the same round?
Perhaps the table above does not give sufficient clarity. Researchers might like to see the success rate in each round. The table below shows the distribution of the grants awarded to different universities. We can see that several universities (e.g. University College London, University of Essex University of Cambridge) have been awarded the grant twice in the same round.
Across all 5 rounds, 7 Universities were found to be given the grant twice in a round. So by taking the division of 7 by all universities that applied (n = 30) and then multiplying it by 1/5 (5 rounds), the result of a university getting funded twice in a round is 4.67%.
Frequency of awards at a department level within a University
What are the chances of being awarded twice in the same around if the applications came from the same department?
Your research centre could be in a position where two applications might be submitted in the same round. Is it then possible that both applications are successful? Well, the short answer is Yes! (because it has happened before) But let’s have a look at the likelihood of that happening. With the current data, I can evaluate the information at a departmental level. In this case, only the Epidemiology and Public Health Department from the University of College London has been successfully given the grant twice within the same round. Thus, it is possible for the research department to submit more than one proposal, although the likelihood of such an event happening is really low. By taking the only department to get the grant twice within the same round (n = 1) divided by the number of departments (n = 35) and multiplying it by 1/5 (5 rounds), that will give me a 0.57% chance of such an event happening. Chances are slim, but if the research centre staggered the submission back to back, and it just so happen that the earlier application gets pushed back one round and that the evaluation of both proposals will be happening in the same round, at least you know that there is still a minimum chance of both proposals getting awarded the grant.
Frequency of awards at a department level
Which department has the highest number of successfully funded projects?
If you are just interested in looking at the type of departments achieving a successful application, then the data is presented in the table below. It would appear that Economics is the top with a count of 6, followed by psychology which is 5 (I combined psychology and experimental psychology). The rest are on average about 1 or 2 from each department across the 5 rounds.
Budget
Funds allocation
What is the average funding per round, and is that consistent across each round?
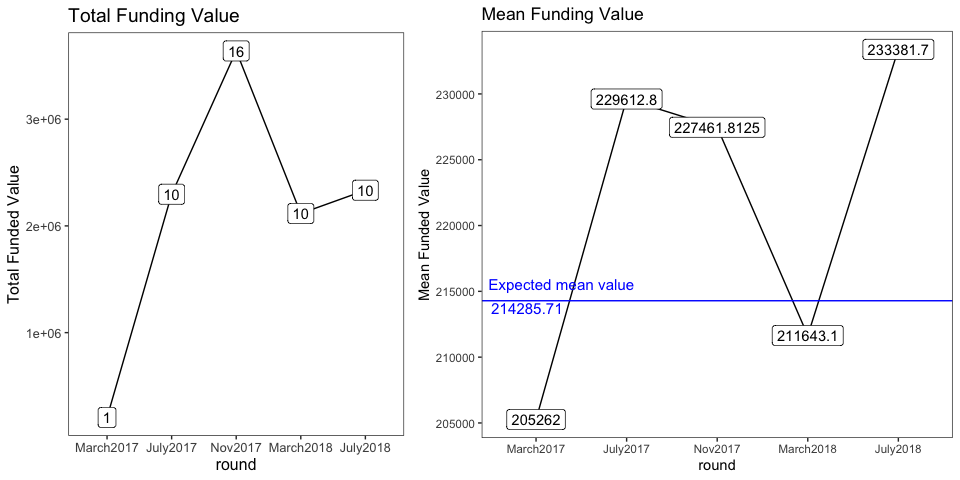
According to the call specification, it says that the grant annual budget will be around £7.5 million. Thus, they expect to fund about 35 grants a year, with about 10 to 12 proposals each round. So the expected mean value should be about £214,285 (£7.5m / 35) per proposal. My two questions to that are: 1) if one round uses fewer funds because it has a lower number of funded projects, does it mean that a higher budget will be allowed for the following rounds within the year? 2) Or is it the case that every round has a fixed budget and that cannot be changed even though there are leftovers from the money pot? Looking at the left graph (i.e. Total Funding Value graph) below for the rounds in 2017, I would infer that there is no fixed budget for every round, and the number of projects in each round is variable as long as the total funded projects for that year do not pass the annual budget of £7.5 million. The observed mean funded value for the July and Nov 2017 was above the expected mean funded value, by over £10,000 to £20,000. Such a trend existed probably because only one proposal was funded in March 2017, so given that there was sufficient budget, it was possible to fund more proposals in the following round. So to answer the question above, I would say that the panel tries to be consistent in every round but it is not a set condition. Those that applied in November 2017, lucky you!
Will we expect a similar trend for November 2018?
This becomes rather interesting. While November 2017 has a high number of funded proposals, it should not happen for November 2018 because of 2 plausible reasons. 1) If the expected number of grants to fund is 35, then the maximum number of projects that can be funded is 35 - (10 + 10) is 15. To be exact, including the 2 missing projects that are not in the dataset (one in March 2018, and another in July 2018) then only 13 projects can be awarded the grant. 2) The number of awarded projects are capped by the grant annual budget of £7.5 million. Since about £4.5 million is already spent in the first two rounds of 2018 (see table below), there is only a budget of approximately £3 million left. So if we divide £3 million by 13 projects, we would get an approximate of £230769.2 each, which is slightly above the expected mean funding budget (great!, though I doubt the target of the ESRC for giving out awards are dependent on reaching a maximum number of projects). If it is budget dependent, then a maximum of 14 grant (using the expected mean value) would be approved before it crosses what’s left in the budget. Either way, to have 16 funded proposals at this stage would be a challenging task, unless all successful proposals for November 2018 request for smaller funding compared to other rounds, which is quite impossible really. Given this reasoning, I would say that ESRC is more likely to select a smaller number of proposals but have a bigger allowance in the budget set for each proposal (I could be wrong), let’s see what happens in the Nov 2018 panel. We will have the data soon.
| round | value | mean value |
|---|---|---|
| March2017 | 205262 | 205262 |
| July2017 | 2296128 | 229613 |
| Nov2017 | 3639389 | 227462 |
| March2018 | 2116431 | 211643 |
| July2018 | 2333817 | 233382 |
Time
What is the average research period?
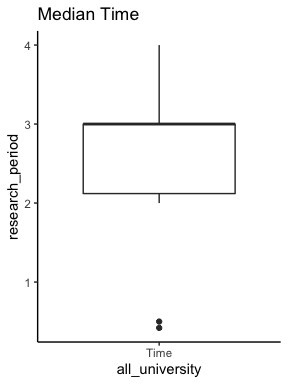
On average, the grants awarded typically lasts for about 2.62 years with a standard deviation of 0.71. I am unsure if it part-time or full-time though. But I would imagine that any project lasting more than 3 years would be part-time since the overhead costs are really high. Plus the fact that if you include research assistants in your application then that would further bring down the grant period since you need to account for their salary and overhead costs as well. You can see the boxplot below for those interested in the quantiles. A breakdown at the university level can be found in the table below.
Research Areas
What are the types of research areas involved?
At a department level, economics may have received the most number of awards, followed by psychology. However, if you rank the table below in the order of descending frequency, we find that it is the psychology research area that is the highest, followed by economics, sociology and the rest. This information tells us that many of the economic research is most likely to be behavioural in nature as supposed to the more quantitative aspects such as econometrics research. It is great to see quite a number of research areas that are not directly part of the Social Sciences. So it would appear that collaborative research across different fields is highly recommended. I would imagine that it reflects well on the ESRC knowing that the subjects/topics funded are multidisciplinary.
Conclusion
In this post, I break down the data that I gathered from the RCUK website into four main areas: Awards, Budgets, Research Period and Research Areas. The Awards section looked at the frequency of awards at a University and Departmental level, as well as the possibility of getting the award twice in the same round. Whilst it is possible, the likelihood of it happening is less than 5% at a University Level, and even smaller (< 1%) at a departmental level. That’s not too bad if you compare it to winning the jackpot (1 in 292 million chance)!
When it comes to money, people always want to have a good idea of how it works. So from the historical trends, it would appear that each round does not have a fixed budget (i.e. £2.5m each), but rather the cost of all the grants awarded that year is no more than £7.5 million. This indicates that the number of grants given in the last round is highly susceptible to the number of grants awarded in the previous 2 rounds. By comparing the observed mean funding value to the expected mean funding value, it appears that March is typically given less and then the budget is re-adjusted in the July round so it looks rather equalised overall. From an applicant perspective, it would seem like March is perhaps not the best round to submit an application because it has lower acceptance rate (see first part of this post) and the panel is very strict with the money. This leads me to think that July seems like a good round for applications with larger costs. Bear in mind that I do not have the data for how much money was requested for each grant application, this is just the amount of money awarded in the end.
From a time period perspective, it would appear that most of the grants awarded are very close to the expected three years. Till date, the longest research period is 4 years from UCL, while the shortest is 5 months from the Manchester Metropolitan Univerisity. So far, no grants with a 5 year time period have been awarded, even though it is stated in the call specification that a maximum research period of 5 years is possible. Again, it does not say whether the researcher applied for a part-time or full-time position. If it is a full-time position, it is probably less than 3 years due to all the other costing involved.
Finally, it is great to see that the research areas stem not only from within the Social Sciences but reaches out to other interesting and fascinating research fields, enabling a collaborative spirit within the academic community.
What a potential applicant can take out of this:
- Don’t worry too much about the research period, as long as you justify the time frame.
- Try and make the project more multidisciplinary, though 50% must relate to the Social Sciences.
- July and Nov rounds seem like a good time to submit the grant application if your project costs are higher than the expected mean value.
- Having a lower project cost does not automatically give you a higher score over others.
- Competition levels are stiff and you need to build a convincing case as to why the panel should fund your application over others.
- Give yourself ample time to think and draft down ideas as you shape it into an exceptionally strong grant application.
- Avoid submitting a proposal in the same round as your colleagues from the same research centre.
I hope this has been helpful information for potential applicants wanting to apply for to the ESRC New Investigators Grant scheme.
Disclaimer: Opinions are my own and not the views of my employer.
Link to Part 1 of this post.
Link to my github page.
Copyright © Aiden Loe, Inc. All rights reserved.