Data mining
Aiden Loe
07 January, 2021
Data Mining (Twitter)
Data mining is slightly different from web scrapping. It concerns itself with the data that is scraped, but it invovles the process of discovering patterns in large data sets.
We are going to extract twitter data through their API.
First of all, you need to create a twitter app before you can have access to the data through their API.
We start off with loading the relevant packages.
require('rtweet')
library("ggplot2")
library("slam")
library("wordcloud") # depends on slam to work
library("stringr")
library("pander")
## Warning: package 'pander' was built under R version 4.0.2Important keys
There is an option to use the information of four important keys to access twitter data. But you have to become a twitter developer first. If not, you just need to have a twitter account and rtweet will sort it out for you when you use its functions.
- consumer_key
- consumer secret
- access_token
- access_secret
Get data
## Get data for a specific Twitter username
tweet_user = lookup_users('elonmusk') #will get user info from the @david_stillwell account

## Explore our new data
ls(tweet_user) #see the elements in the new list variable
## [1] "account_created_at" "account_lang"
## [3] "bbox_coords" "coords_coords"
## [5] "country" "country_code"
## [7] "created_at" "description"
## [9] "display_text_width" "ext_media_expanded_url"
## [11] "ext_media_t.co" "ext_media_type"
## [13] "ext_media_url" "favorite_count"
## [15] "favourites_count" "followers_count"
## [17] "friends_count" "geo_coords"
## [19] "hashtags" "is_quote"
## [21] "is_retweet" "lang"
## [23] "listed_count" "location"
## [25] "media_expanded_url" "media_t.co"
## [27] "media_type" "media_url"
## [29] "mentions_screen_name" "mentions_user_id"
## [31] "name" "place_full_name"
## [33] "place_name" "place_type"
## [35] "place_url" "profile_background_url"
## [37] "profile_banner_url" "profile_expanded_url"
## [39] "profile_image_url" "profile_url"
## [41] "protected" "quote_count"
## [43] "quoted_created_at" "quoted_description"
## [45] "quoted_favorite_count" "quoted_followers_count"
## [47] "quoted_friends_count" "quoted_location"
## [49] "quoted_name" "quoted_retweet_count"
## [51] "quoted_screen_name" "quoted_source"
## [53] "quoted_status_id" "quoted_statuses_count"
## [55] "quoted_text" "quoted_user_id"
## [57] "quoted_verified" "reply_count"
## [59] "reply_to_screen_name" "reply_to_status_id"
## [61] "reply_to_user_id" "retweet_count"
## [63] "retweet_created_at" "retweet_description"
## [65] "retweet_favorite_count" "retweet_followers_count"
## [67] "retweet_friends_count" "retweet_location"
## [69] "retweet_name" "retweet_retweet_count"
## [71] "retweet_screen_name" "retweet_source"
## [73] "retweet_status_id" "retweet_statuses_count"
## [75] "retweet_text" "retweet_user_id"
## [77] "retweet_verified" "screen_name"
## [79] "source" "status_id"
## [81] "status_url" "statuses_count"
## [83] "symbols" "text"
## [85] "url" "urls_expanded_url"
## [87] "urls_t.co" "urls_url"
## [89] "user_id" "verified"#how long the account has been a Twitter user for
tweet_user$account_created_at## [1] "2009-06-02 20:12:29 UTC"#user's name
tweet_user$name## [1] "Elon Musk"#how many followers the account has
tweet_user$followers_count## [1] 41476818Harvest data
Here we want to extract at most up to 3200 tweets. This is the limit anyway so you can’t cross it.
However, more often than not, you will not get the full 3200 tweets. It will always be less than that.
We want to convert it into a data frame so we can use the data easily in R.
## harvest tweets from user (usually return fewer)
tweets = get_timeline('elonmusk', n=3200)  # no re-tweets.
#names(tweets) #view tweets
dim(tweets) #rows of tweets
## [1] 3199 90Reorganise data
Here we want to reorganise data to use the columns we are interested in.
source = application the tweet came from (i.e. iphone or android)
text = the tweet
created = time of which the tweet was created
## reorganise data
library("tidyr")
library("dplyr")
## Warning: package 'dplyr' was built under R version 4.0.2tweets1 <- tweets %>%
dplyr::select(user_id, source, text, created_at) %>% ## select these 4 columns
filter(source %in% c("Twitter for iPhone")) # select only rows with iphone
names(tweets1)## [1] "user_id" "source" "text" "created_at"head(tweets1)## # A tibble: 6 x 4
## user_id source text created_at
## <chr> <chr> <chr> <dttm>
## 1 44196397 Twitter fo… @teslaownersSV Well, back to work … 2021-01-07 15:33:02
## 2 44196397 Twitter fo… @teslaownersSV How strange 2021-01-07 15:32:27
## 3 44196397 Twitter fo… Use Signal 2021-01-07 12:56:10
## 4 44196397 Twitter fo… @TheHackersNews Ya don’t say. Remind… 2021-01-07 12:49:15
## 5 44196397 Twitter fo… @UniverCurious Fast water with tiny … 2021-01-07 11:48:06
## 6 44196397 Twitter fo… @flcnhvy Yes, and then Occam’s razor… 2021-01-07 10:30:27Tweets most frequently
Let’s find out at what point of time he tweets the most.
We will use the data frame that we just cleaned.
It only contains:
source = application the tweet came from (i.e. iphone or android)
text = the tweets
created = time of which the tweet was created
## Investigate when he tweets the most (time of the day)
library("lubridate")
library("scales")
library('dplyr')

tweets1 %>%
  count(source, hour = hour(with_tz(created_at, "EST"))) %>%  #count observations by source.
  mutate(percent = n / sum(n)) %>% #add a new column into the data frame

  # plot it
  ggplot(aes(hour, percent, color = source)) +
  geom_line() +
  scale_y_continuous(labels = percent_format()) +
  labs(x = "Hour of day (EST)",
       y = "% of tweets",
color = "") 
Average char per tweet
What is the average number of characters per tweet?
#apply the nchar function (number of characters) to the text column of every row of the dataset
chars_per_tweet = sapply(tweets1$text, nchar)
summary(chars_per_tweet) #report average number of characters per tweet
## Min. 1st Qu. Median Mean 3rd Qu. Max.
## 1.00 36.25 67.00 92.80 130.00 394.00hist(chars_per_tweet, breaks=30) #this is the default R histogram plot
Average word per tweet
What is the average number of words per tweet?
## What is the average number of words per tweet?
word_list = strsplit(tweets1$text, " ") #split the tweets into separate words by using spaces
words_per_tweet = sapply(word_list, length) #count the number of word elements in each tweet
summary(words_per_tweet) #report average number of words per tweet
## Min. 1st Qu. Median Mean 3rd Qu. Max.
## 1.00 4.00 9.00 13.39 19.00 55.00# the following uses ggplot2 to do the plot, which is much prettier.
words_per_tweet_df = as.data.frame(words_per_tweet) #ggplot requires the data to be in a data frame
ggplot(words_per_tweet_df, aes(x=words_per_tweet, group=words_per_tweet)) +
geom_bar(fill="blue") +
scale_x_continuous(limits=c(0,30))## Warning: Removed 355 rows containing non-finite values (stat_count).## Warning: Removed 1 rows containing missing values (geom_bar).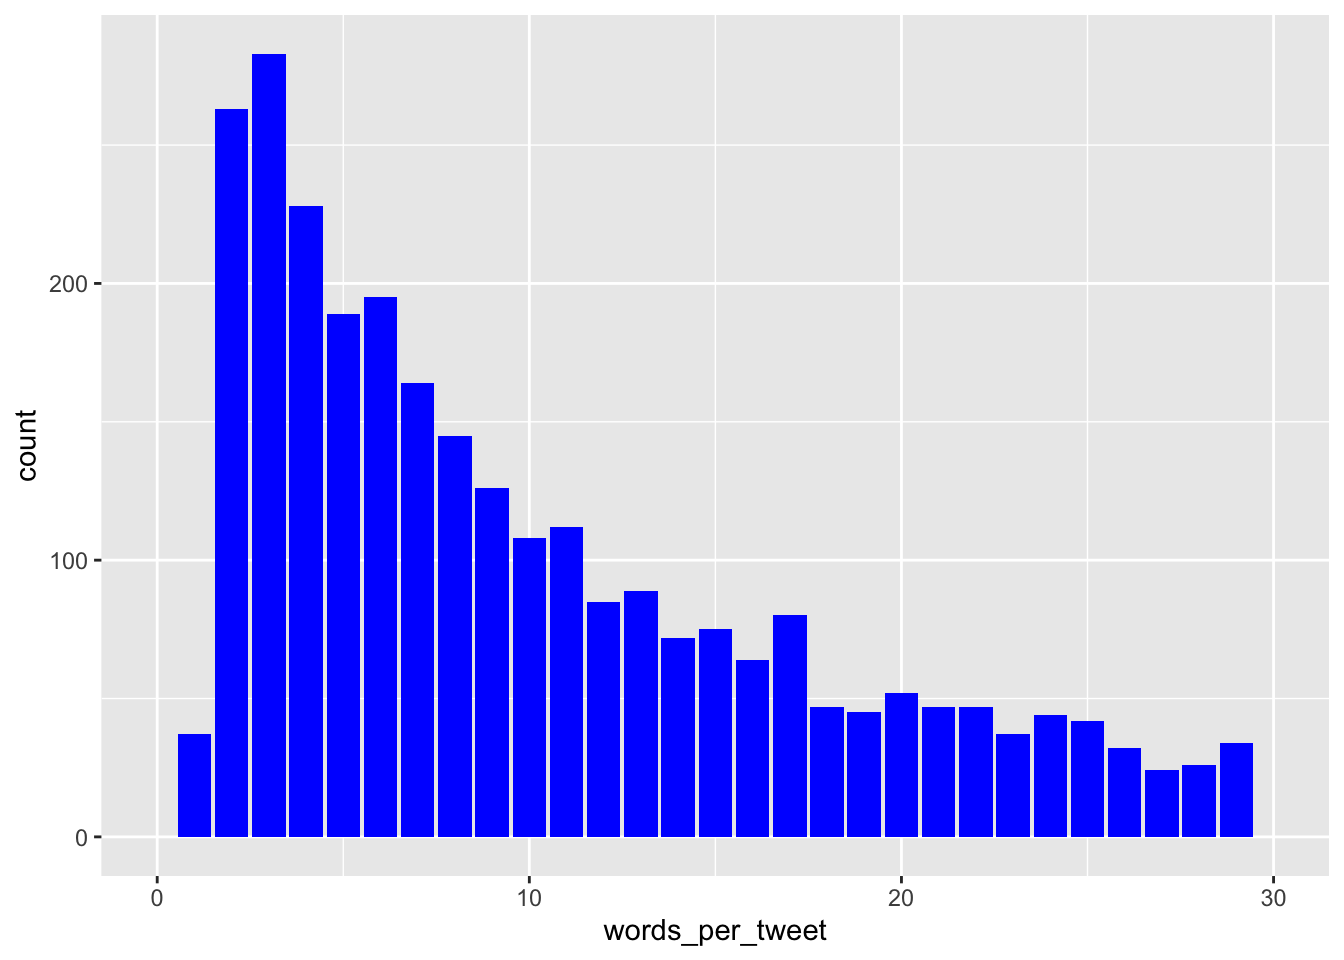
Top Hash
What are the top 10 most commonly used hashtags?
# get the hashtags. This function looks for anything that starts with a # and is followed by text
user_hashtags <- str_extract_all(tweets1$text, "#\\S+")
user_hashtags  = unlist(user_hashtags) #put tags in vector

user_hashtags_freq <- table(user_hashtags) #calculate hashtag frequencies
user_hashtags_freq_order <- sort(user_hashtags_freq, decreasing=TRUE) #order the frequencies from most to least
head(user_hashtags_freq_order,10) #report the 10 most common hashtags
## user_hashtags
## #LaunchAmerica #Dragon #COVID19 #CrewDragon
## 10 3 2 2
## #LaunchAmerica. #tesla #* #1
## 2 2 1 1
## #Arkhipov, #CancelNewsNetwork
## 1 1Word Cloud
Usually, you would have to remove important stopwords before creating a word cloud.
Here we are just using some stopwords.
#counts unique words from each tweet (so if you use the same word twice in a tweet it'll only be counted once)
uniq_words_per_tweet = sapply (word_list, function(x) unique(x))
uniq_words = unlist(uniq_words_per_tweet) #they're in a list, so convert to a huge vector
length(uniq_words) #shows how many total words we've collected from this user
## [1] 40576uniq_words<- uniq_words[!uniq_words %in% c("a", "in", "to", "is", "for", "but", "and", "on", "the", "of")] # remove some stopwords.
uniq_words_freq = table(uniq_words) #number of times that each word is displayed
wordcloud(names(uniq_words_freq),scale=c(8,1.5), min.freq=10, uniq_words_freq, random.order=FALSE, colors= "#1B9E77") #Produces the word cloud
title("words in Tweets",cex.main=3, col.main="gray51") #gives the word cloud a title
Sentiment Analysis
This is a simple example of how one can conduct a simple sentiment analysis.
We will be mining twitter data of 3 UK telecommunication companies.
The tweets will be taken from the customer support accounts.
We will then evaluate the sentiment of these tweets.
We will plot it and then compare the sentiment score between the companies.
You may begin going through the code from there.
But you must first get your consumer and secret keys to access the Twitter API.
Load Dictionaries
The first thing to do is to load the dictionaries of positive and negative words.
We are using the Sentiment Lexicon.
It has around 6800 words Hu and Lui, KDD-2004.
## Positive and negative word dictionaries
# Make sure you have positive_words.txt and negative_words.txt in your working directory
# You can open the files in Notepad to see what's in them.
pos = readLines("datasets/positive_words.txt")
neg = readLines("datasets/negative_words.txt")
Search data
We are going to search the twitter data of 3 UK telecommunication companies.
Then we clean the tweets of things we don’t want in it.
This can be punctuations, numbers, html links etc..
## Get tweets mentioning 3 UK companies
# name the companies
companyNameOne <- "@ThreeUKSupport"
companyNameTwo <- "@VodafoneUKhelp"
companyNameThree <- "@BTcare"
extractTweetsNumber <- 3200 #get the 500 most recent Tweets about each

# Notice we're using searchTwitter function. We didn't use this function before in the previous Twitter API lecture.
# It uses a different Twitter API end point. Rather than getting the tweets from a certain account,
# it gets the Tweets that contain a certain text string.
companyOne = search_tweets(companyNameOne, n=extractTweetsNumber, lang="en")
companyTwo = search_tweets(companyNameTwo, n=extractTweetsNumber, lang="en")
companyThree = search_tweets(companyNameThree, n=extractTweetsNumber, lang="en")

# We only want the actual tweets rather than the meta-data, and this function does that.

companyOne =  companyOne$text
companyTwo =  companyTwo$text
companyThree  =  companyThree$text

## Clean the Tweets
companies = list(companyOne, companyTwo, companyThree) #create a list with the three companies in it

compan2 <- NULL
for (i in 1:length(companies)) { #set up a loop to do all three companies
  #remove retweet entities
  companies[i] = lapply(X = companies[i], gsub,
                        pattern="(RT|via)((?:\\b\\W*@\\w+)+)", replacement="")

  #remove at people
  (companies[i] = lapply(X = companies[i], gsub,
                         pattern="@\\w+", replacement=""))
  # remove punctuation
  (companies[i] = lapply(X = companies[i], gsub,
                         pattern="[[:punct:]]", replacement=""))
  # remove numbers
  (companies[i] = lapply(X = companies[i], gsub,
                         pattern="[[:digit:]]", replacement=""))
  # remove html links
  (companies[i] = lapply(X = companies[i], gsub,
                         pattern="http\\w+", replacement=""))
  # remove new lines and replace with a space
  (companies[i] = lapply(X = companies[i], gsub,
                         pattern="\\n", replacement=""))
  # remove unnecessary spaces
  #anything with 2 or more spaces, replace with 1
  (companies[i] = lapply(X = companies[i], gsub,
                         pattern="[ \t]{2,}", replacement=""))
  #remove any spaces at the beginning of tweets
  (companies[i] = lapply(X = companies[i], gsub,
                         pattern="^\\s+|\\s+$", replacement=""))

  # remove NAs in each specific  txt to setup for Corpus and score_sentiment
  companies[i] = companies[i][!is.na(companies[i])]

  #unlist
  compan <- unlist(companies[i])
  # makes everything lower case
  (compan2[[i]] = sapply(X = compan, try.error))

}

#put the data back in the companyOne/Two/Three variables, just for ease of use
companyOne = companies[[1]]
companyTwo = companies[[2]]
companyThree = companies[[3]]
Sentiment score
Code for sentiment analysis was copied heavily from here
We derive a sentiment score for every tweet.
The idea is that every word in a tweet will be compared to the positive and negative dictionary. For every positive word found, a score of +1 is given, and a score of -1 is given for every negative word found in the sentence.
# apply function score.sentiment and add new variable in column
companyOne.score = score.sentiment(companyOne, .progress="text", pos, neg)

companyTwo.score = score.sentiment(companyTwo, .progress="text", pos, neg)

companyThree.score = score.sentiment(companyThree, .progress="text", pos, neg)

# have a look at what Tweets are labeled positive and negative:
#head(companyOne.score)
Plot Sentiment score
Once we have the score for every sentence, we can then plot it on a bar chart.
## Produce a bar graph showing which companies are on average more positively/negatively rated.

# name the companies
companyOne.score$telecom = companyNameOne
companyTwo.score$telecom = companyNameTwo
companyThree.score$telecom = companyNameThree

# combine all scores into a single variable
all.scores = rbind(companyOne.score, companyTwo.score, companyThree.score)
all.scores <- all.scores[,c(1,3,2)] #reorder the columns

# Gives you the average of each of the three categories
meanscore = tapply(all.scores$score, all.scores$telecom, mean)

#### sem
# first calculate sd
# then use sd to calculate se
sdscore = tapply(all.scores$score, all.scores$telecom, sd)
companyOne.SEm <- sdscore[1]/sqrt(nrow(companyOne.score))
companyTwo.SEm <- sdscore[2]/sqrt(nrow(companyThree.score))
companyThree.SEm <- sdscore[3]/sqrt(nrow(companyThree.score))
sem <- c(companyOne.SEm,companyTwo.SEm,companyThree.SEm) # put them back

# create a data frame to be plotted
df = data.frame(telecom=names(meanscore), meanscore=meanscore, sem=sem)

values = c("red","blue", "green") #bar colours in the plot
limits <- aes(ymax = df$meanscore + df$sem, # setting the upper and lower limits
              ymin = df$meanscore - df$sem) # setting the upper and lower limits

#do the plot
ggplot(df, aes(x=telecom, y=meanscore, fill=factor(telecom))) +
  geom_bar(data=df,stat="identity") +
  geom_errorbar(limits, position = position_dodge(width = 0.9), width = 0.25) +
  ggtitle("Average Sentiment Score") +
  scale_fill_discrete(guide = guide_legend(title = "Companies")) # title text
## Warning: Use of `df$meanscore` is discouraged. Use `meanscore` instead.## Warning: Use of `df$sem` is discouraged. Use `sem` instead.## Warning: Use of `df$meanscore` is discouraged. Use `meanscore` instead.## Warning: Use of `df$sem` is discouraged. Use `sem` instead.
T test for sentiment score
We can further confirm our visual result by running a simple pair-wise t-test.
# t.test between the groups
pander(with(all.scores,(t.test(score[telecom=="@ThreeUKSupport"],score[telecom=="@VodafoneUKhelp"]))),style="simple")| Test statistic | df | P value | Alternative hypothesis | mean of x | mean of y |
|---|---|---|---|---|---|
| 0.6044 | 2.057 | 0.6055 | two.sided | -0.1304 | -0.3333 |
pander(with(all.scores,(t.test(score[telecom=="@ThreeUKSupport"],score[telecom=="@BTcare"]))),style="simple")| Test statistic | df | P value | Alternative hypothesis | mean of x | mean of y |
|---|---|---|---|---|---|
| -0.09867 | 111.2 | 0.9216 | two.sided | -0.1304 | -0.117 |
pander(with(all.scores,(t.test(score[telecom=="@VodafoneUKhelp"],score[telecom=="@BTcare"]))),style="simple")| Test statistic | df | P value | Alternative hypothesis | mean of x | mean of y |
|---|---|---|---|---|---|
| -0.6046 | 2.653 | 0.5932 | two.sided | -0.3333 | -0.117 |